Monitoring ESXi Server health using Nagios/Opsview
As part of a project I am currently working on I have a requirement to check that my clients’ infrastructure is working to the best of its ability. Whilst we perform regular checks to ensure the sites are running as expected we don’t currently have an easy way to check the health of the ESX hosts that the virtual servers run on. Until now.
I had spent a lot of time trying to “hack” SNMP to be enabled on the ESXi boxes which involved editing the snmp.xml file in the “unsupported” console on the host but after enabling this found that it didnt give me the data I was looking for to run my checks against. Looking a bit further I found a python script which queries the CIM service on the ESX host to find out whether the hardware is working as expected. The script uses the CIM service to check the ESX Health Status and report back to your monitoring platform what the current status of the host is.
Installation is fairly straightforward. The following details are for an Opsview install running on Ubuntu 8.04LTS server but should be easily adaptable to any installation if needs be.
First login to your server as normal and download the latest version of the pywbem module (http://archive.ubuntu.com/ubuntu/pool/universe/p/pywbem/pywbem\_0.7.0.orig.tar.gz)
opsview@LON-SVR-MON1:~$ wget http://archive.ubuntu.com/ubuntu/pool/universe/p/pywbem/pywbem_0.7.0.orig.tar.gz
Once you have downloaded the module extract and run the python installer as root
opsview@LON-SVR-MON1:~$ tar -xzf pywbem_0.7.0.orig.tar.gz
opsview@LON-SVR-MON1:~$ cd pywbem-0.7.0/
opsview@LON-SVR-MON1:~/pywbem-0.7.0$ sudo python setup.py install
Next you need to download the check_esx_wbem.py script (http://communities.vmware.com/docs/DOC-7170) and place it in your libexec folder
opsview@LON-SVR-MON1:~/pywbem-0.7.0$ cd /usr/local/nagios/libexec/
opsview@LON-SVR-MON1:/usr/local/nagios/libexec# wget http://communities.vmware.com/servlet/JiveServlet/downloadBody/7170-102-5-4233/check_esx_wbem.py
opsview@LON-SVR-MON1:/usr/local/nagios/libexec# sudo chown nagios:nagios check_esx_wbem.py
opsview@LON-SVR-MON1:/usr/local/nagios/libexec# sudo chmod a+x check_esx_wbem.py
You can test this from the command line using the following command
opsview@LON-SVR-MON1:/usr/local/nagios/libexec# ./check_esx_wbem.py https://10.9.0.65:5989 root Password
In the case above I received the following output but if everything is working as expected the script should return “OK”
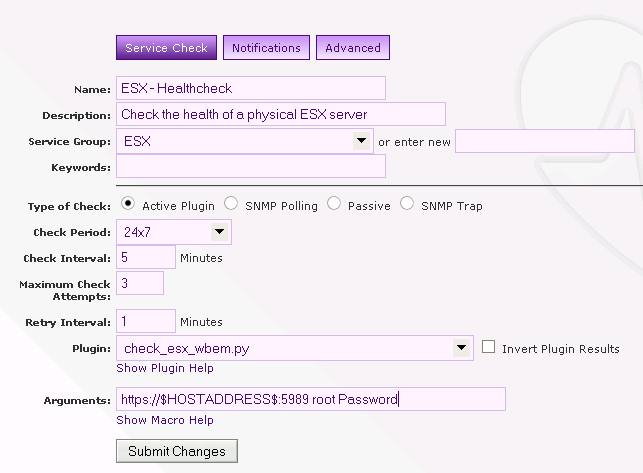
WARNING : Power Supply 3 Power Supplies<br>CRITICAL : Power Supply 2 Power Supply 2: Failure detected<br>Now we have confirmed the script is running we need to add it to Opsview. The first step here is to reload Opsview to pickup the new plugin. Once complete goto Configuration -> Service Checks and Create New Service Check. Setup your check in a similar way to the image below (remember to substitute “root” and “Password” with a valid username and password to login to your ESX host

Save this service check and then apply this to your ESX hosts. If you have multiple ESX hosts that have different username and passwords then you don’t need to create multiple Service Checks as the later versions of Opsview let you specify exceptions when you configure the check for a host

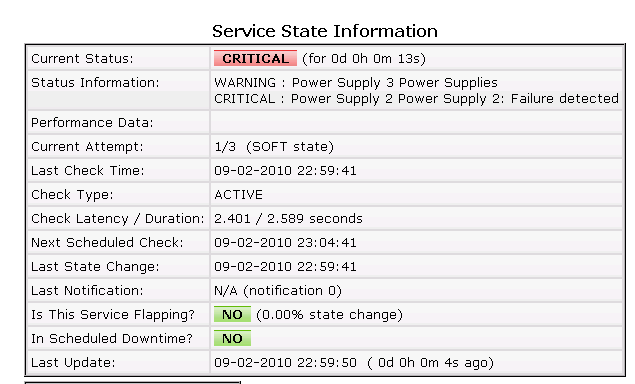
Once you have configured this reload Opsview and wait for Opsview to start checking the ESX server(s). Below is the screenshot from my server with its disconnected PSU

This should now allow you to keep an eye on your ESX hosts alongside the rest of your network monitoring system.